FunBarONT pipeline, ITS 
This example data analyses follows FunBarONT workflow as implemented in PipeCraft2’s pre-compiled pipelines panel.
FunBarONT is a specialized pipeline for processing Oxford Nanopore Technologies (ONT) fungal barcoding data, specifically targeting the ITS rRNA gene region. This pipeline is optimized for long-read sequencing data and incorporates quality filtering, demultiplexing, sequence polishing, and taxonomic assignment to generate high-confidence fungal identifications.
Starting point
This example dataset consists of ITS rRNA gene amplicon sequences; targeting fungi:
single-end Oxford Nanopore sequencing data;
demultiplexed set (per-sample fastq files, see demultiplexing here);
indexes and adapters have already been removed;
sequences are generated using Nanopore sequencing technology (read lengths typically 1-10+ kb).
when working with your own ONT data …
… then please ensure that the fastq files are properly demultiplexed and contain sample identifiers in the file names. For mixed barcode runs that have not been demultiplexed, preprocessing may be required to split reads by barcode before using the FunBarONT pipeline.
SELECT PIPELINE –> FunBarONT.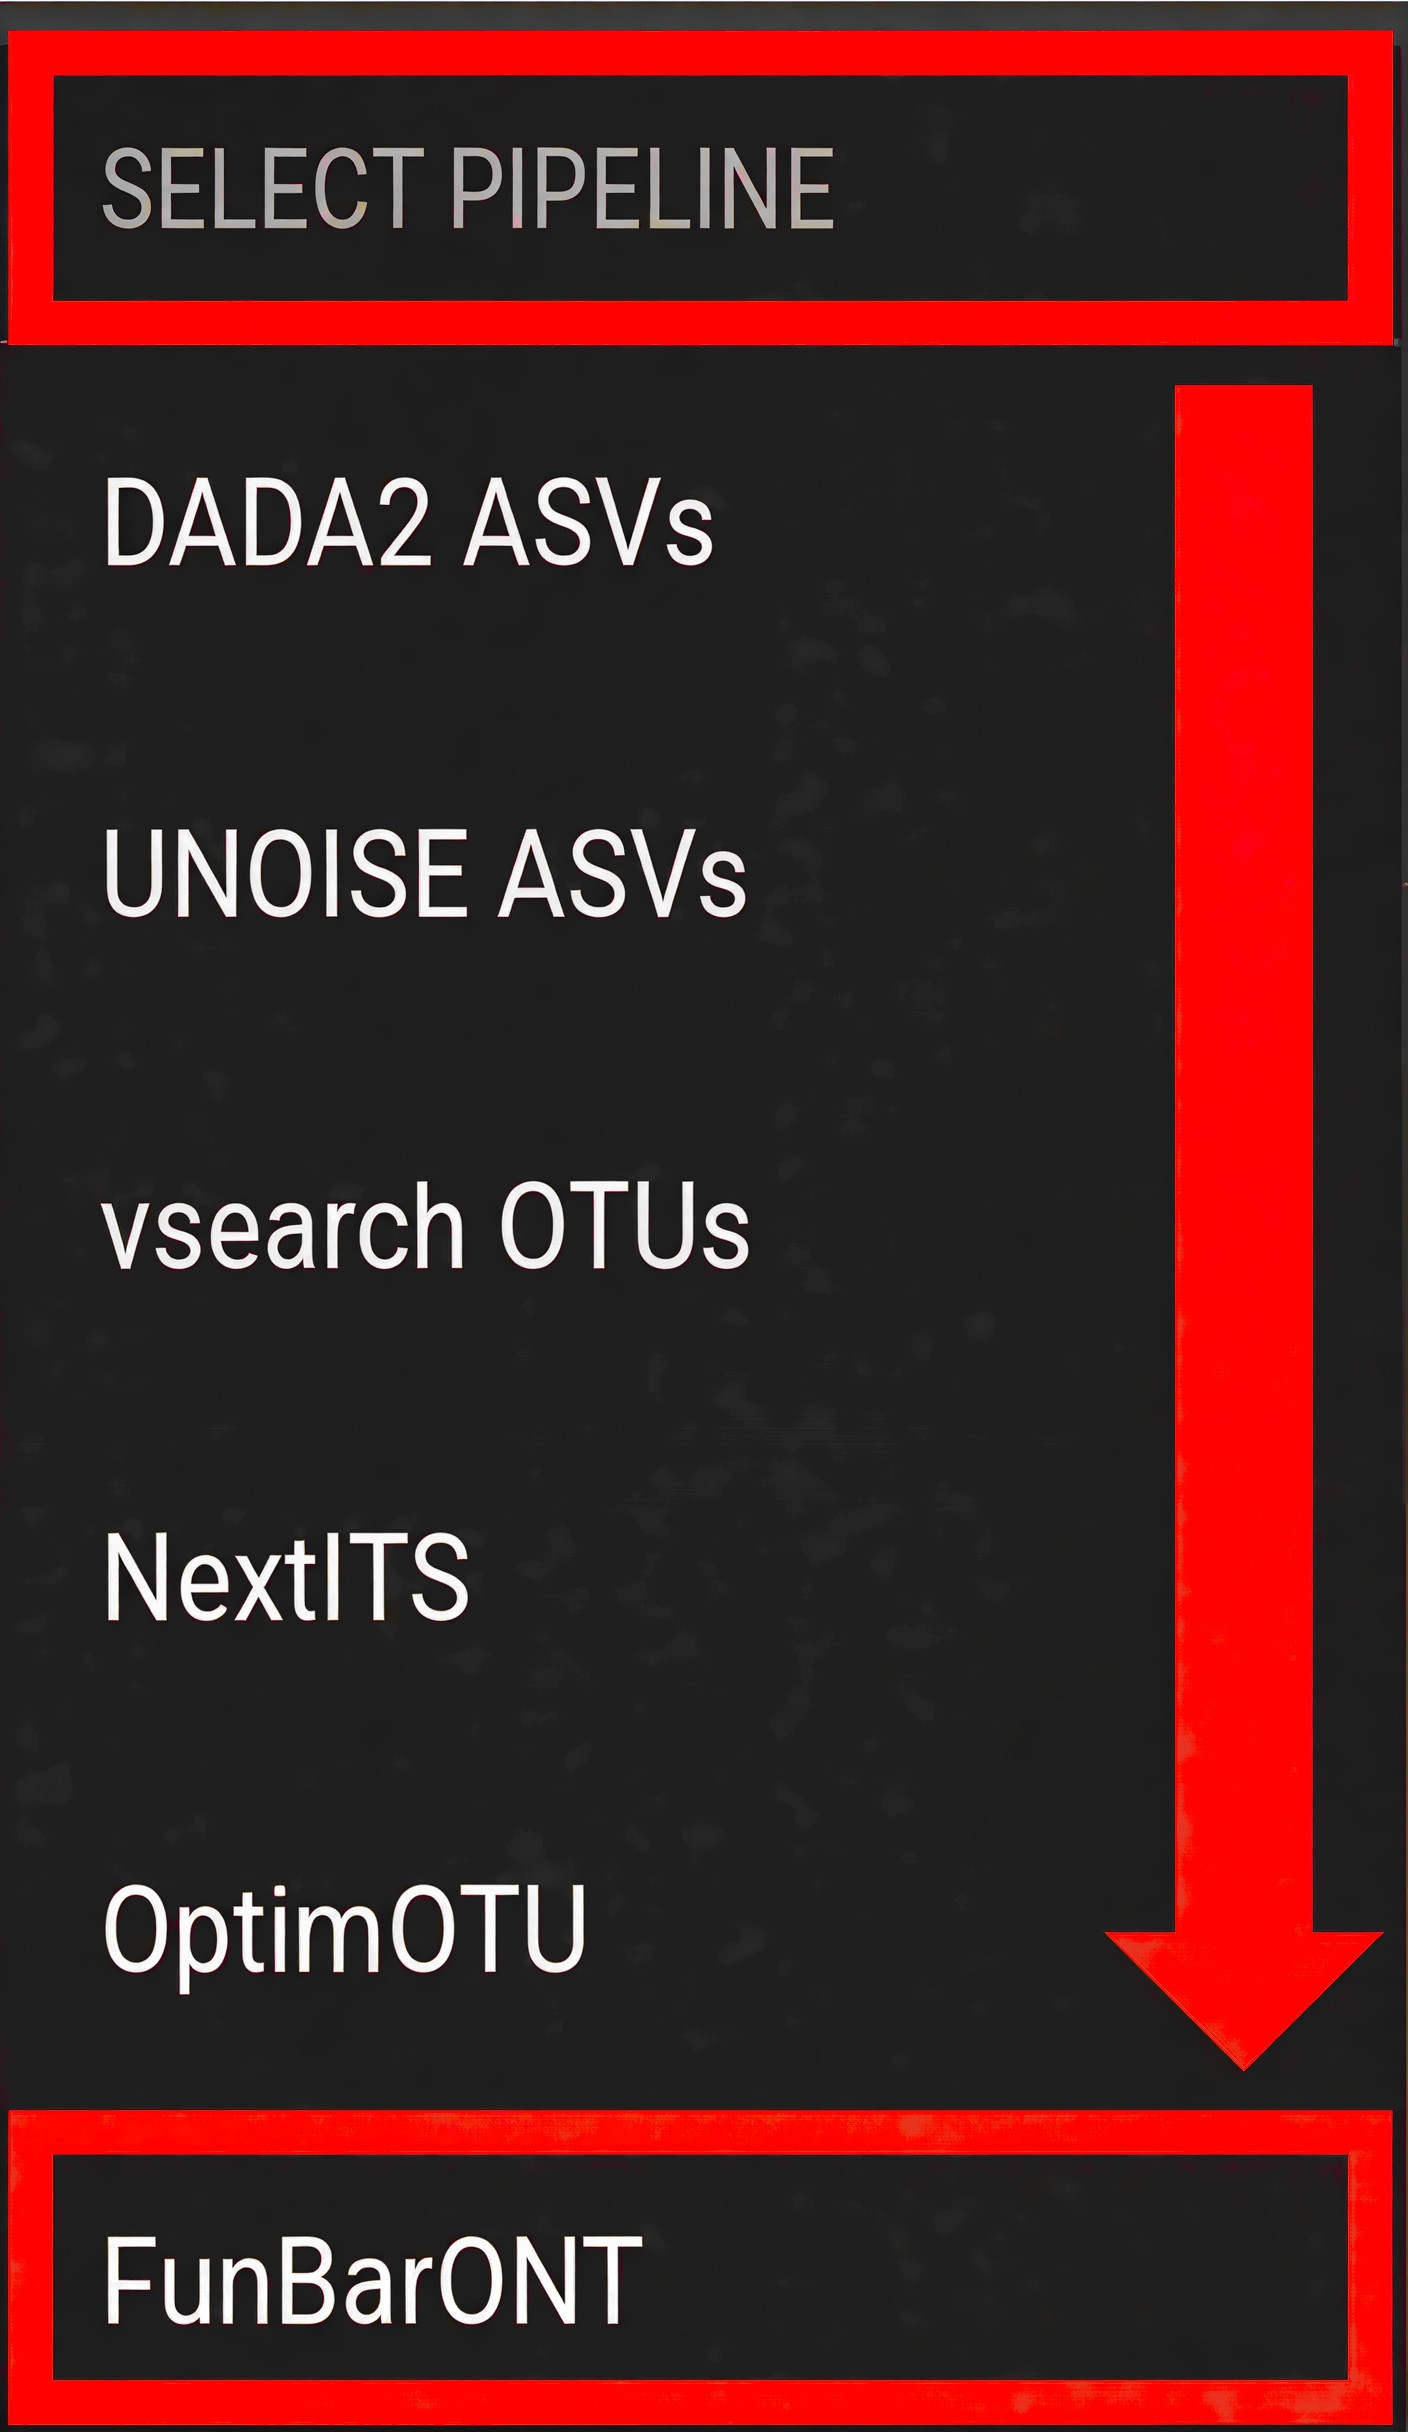
SELECT WORKDIR and specify sequence files extension as *.fastq;sequencing read types is not an effective option in this pipeline (just click ‘Confirm’).Workflow overview
The FunBarONT pipeline consists of the following processing steps designed to handle the characteristics of Oxford Nanopore long-read sequencing data:
Quality Control (NanoPlot) - Generates quality reports and statistics for each sample
Quality Filtering (chopper) - Filters reads based on quality scores and length thresholds
Clustering (VSEARCH) - Groups similar sequences into clusters/OTUs
Read Mapping (minimap2) - Maps reads to cluster centroids for consensus generation (no separate output; intermediate step for polishing)
Sequence Polishing (racon + medaka) - Corrects sequencing errors to generate high-accuracy consensus sequences
ITS Extraction (ITSx) - Extracts the ITS region from fungal sequences (optional)
Taxonomy Assignment (BLAST) - Assigns taxonomic classification using BLAST against a reference database
FunBarONT tools and versions (v1.0):
minimap2 v2.26 (read mapping and alignment)
samtools v1.20 (sequence alignment/map format utilities)
bcftools v1.20 (variant calling and file processing)
racon v1.4.20 (sequence polishing)
medaka v1.11 (neural network consensus calling for high-accuracy sequences)
vsearch v2.30 (clustering and chimera detection)
chopper v0.7.1 (quality filtering for long reads)
filtlong v0.2.5 (additional long-read quality filtering)
ITSx v2.1 (ITS region extraction)
BLAST v2.15 (local sequence alignment and taxonomy assignment)
seqkit v2.12 (sequence manipulation utilities)
nextflow v24.04 (workflow orchestration)
nanoplot v1.42 (quality control and visualization)
Python 3.10 (scripting and analysis environment)
Note
The FunBarONT pipeline is specifically designed for Oxford Nanopore fungal barcoding data. All steps run automatically in sequence once the workflow is started.
minimap2 is used internally to align reads to cluster centroids before polishing—this step produces no separate output files but is essential for high-accuracy consensus calling.
Input data preparation
Before starting the FunBarONT workflow in PipeCraft2, ensure your input data is properly prepared:
File naming convention:
All fastq files should follow a consistent naming pattern with the sample identifier at the beginning:
 sample_name.fastq
 sample_name.fastq.gz
Directory structure:
 my_fungal_barcoding/
 └── sequences/         # SELECT THIS FOLDER AS WORKING DIRECTORY
     ├── sample1.fastq
     ├── sample2.fastq
     ├── sample3.fastq
     └── ...
Data quality considerations:
Read quality: The pipeline includes quality filtering steps to handle the sequencing errors.
Read length: Ensure that the expected amplicon length (including ITS and flanking regions) matches your read lengths. The default minimum length filtering is typically set to accommodate full-length ITS amplicons (~500-700 bp for fungi).
Mixed samples: If your data contains mixed fungal species or environmental samples, the clustering steps will group similar sequences together.
Quality control (NanoPlot)
The FunBarONT pipeline uses NanoPlot to assess the quality of your Oxford Nanopore sequencing data. This step generates comprehensive quality reports and statistics for each sample.
NanoPlot produces:
Quality distribution plots - Visualize the distribution of read quality scores
Read length distribution - Shows the length distribution of your sequencing reads
NanoStats.txt - Summary statistics including read counts, mean quality, and length metrics
NanoPlot-report.html - Interactive HTML report with all quality metrics
Key quality metrics to consider:
Mean quality score: Typically > Q10 is acceptable for ONT basecalling data
Read length distribution: Should center around your expected amplicon length
Total reads: Verify adequate sequencing depth per sample
Output directory |
|
|---|---|
|
NanoPlot results folder per sample |
NanoPlot-report.html |
interactive HTML quality report |
NanoStats.txt |
summary statistics (read counts, quality, length) |
Quality filtering (chopper)
Quality filtering uses chopper to remove low-quality reads that do not meet specified thresholds. This step is critical for Oxford Nanopore data, which can have variable error rates.
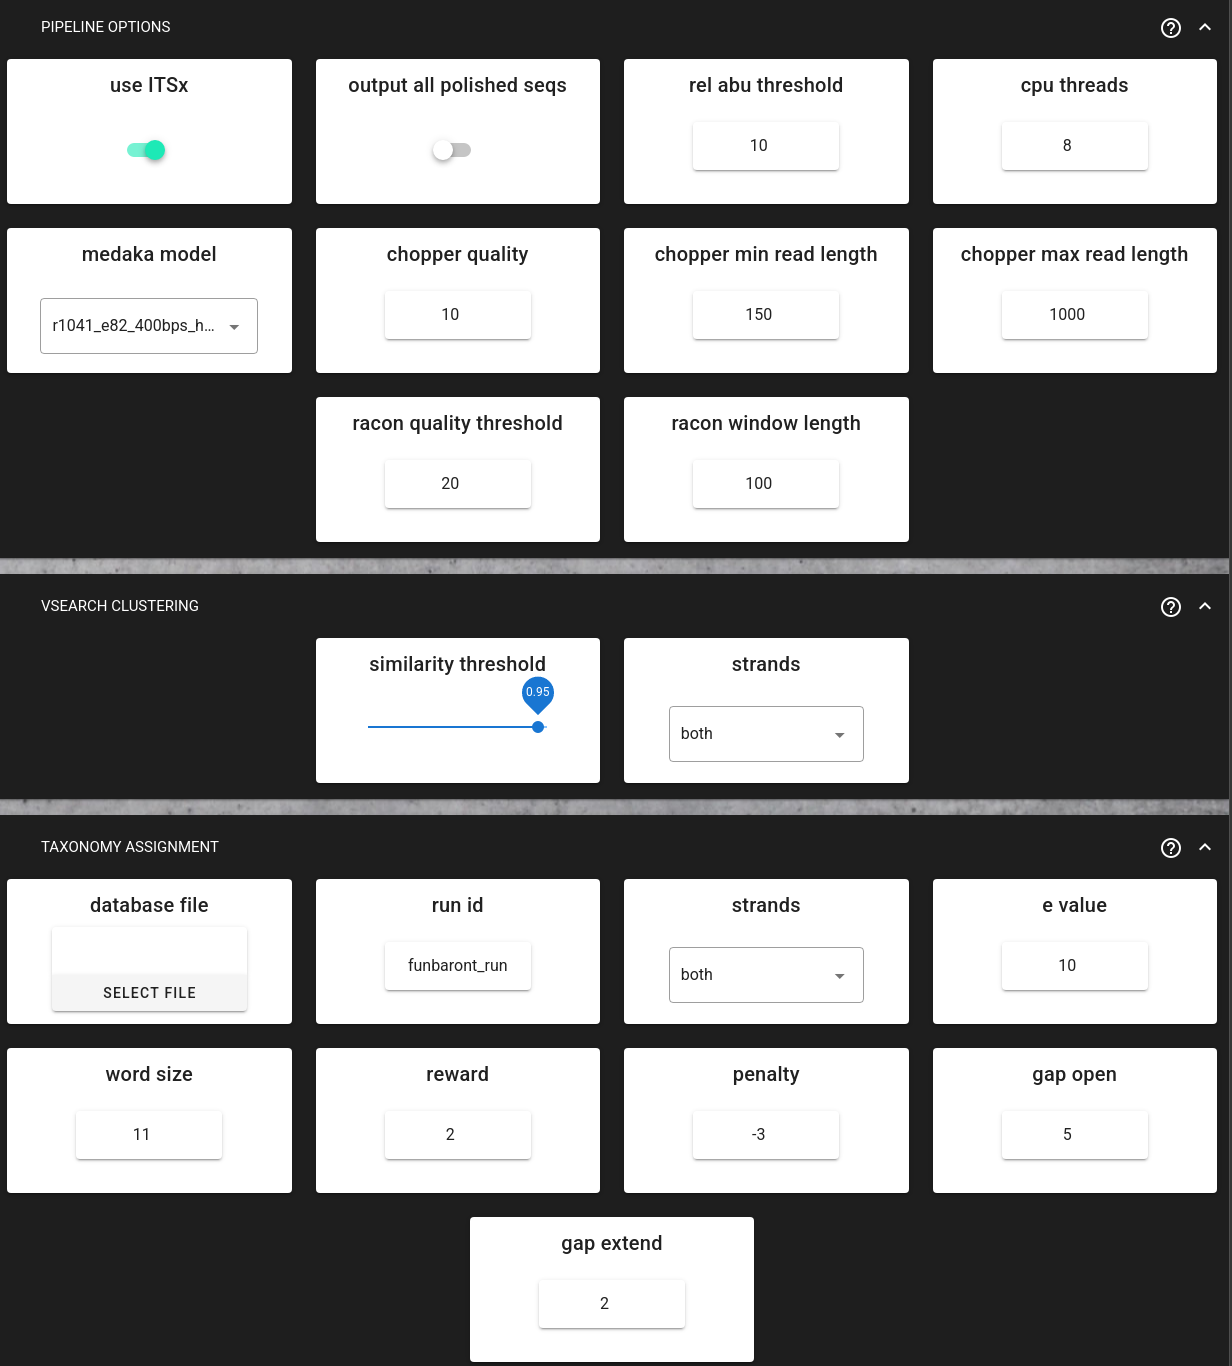
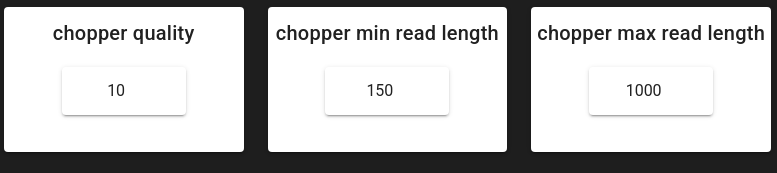
Configurable parameters:
chopper_quality (default: 10) - Minimum read quality score. Reads below this threshold are discarded.
chopper_min_read_length (default: 150 bp) - Minimum read length. Shorter reads are removed.
chopper_max_read_length (default: 1000 bp) - Maximum read length. Longer reads are removed.
Why these settings for ITS barcoding:
What “quality 10” means: ONT FASTQ qualities are reported on the Phred scale, where a score Q corresponds to an expected base-call error probability P via:
Q = -10 * log10(P). So Q10 corresponds to ~10% expected error per base (roughly 90% per-base accuracy), Q12 to ~6.3%, Q15 to ~3.2%, and Q20 to ~1%.Logic behind `chopper_quality = 10`: this setting removes the “very noisy” reads that tend to: 1) inflate the number of spurious clusters/OTUs, 2) reduce identity to the true ITS sequence (hurting BLAST hits), and 3) make polishing less stable (because alignments contain too many mismatches/indels). At the same time, ONT ITS datasets often benefit from keeping sufficient depth for clustering and consensus generation, so Q10 is a pragmatic balance between read retention and error reduction.
Logic behind `min_read_length = 150`: fungal ITS amplicons are typically ~400–800 bp, but real ONT data may contain truncated reads. A 150 bp minimum is mainly a guardrail to remove very short fragments (adapter remnants, primer dimers, broken reads) while still allowing partially truncated reads to contribute during clustering/polishing. If you require only near full-length ITS reads, increase this to e.g. 300–400 bp.
Logic behind `max_read_length = 1000`: reads much longer than the expected ITS amplicon are often off-target products, concatemers, or chimeric/multi-amplicon reads. Keeping an upper bound avoids these dominating alignments and distorting clustering/consensus.
NanoPlot results for this example dataset
Looking at the NanoStats.txt files produced for this example data, the quality picture across the four samples is:
Sample |
Reads |
Mean len (bp) |
Median len (bp) |
Mean quality (Q) |
>Q10 retained |
>Q15 retained |
|---|---|---|---|---|---|---|
CLT01 |
6,920 |
1,543 |
1,755 |
Q17.0 |
98.5 % |
85.0 % |
CLT02 |
19,621 |
1,404 |
1,466 |
Q16.6 |
98.5 % |
80.3 % |
CLT15 |
992 |
1,254 |
1,309 |
Q17.0 |
98.3 % |
83.8 % |
CLT16 |
212 |
525 |
522 |
Q15.1 |
97.6 % |
63.2 % |
What these numbers tell us about the Q10 threshold: In all four samples, Q10 retains 97.6–98.5 % of reads. This confirms that Q10 is a very permissive floor — it only removes the truly unusable bottom fraction, while more stringent thresholds such as Q15 would already drop 17–37 % of reads. For clustering and consensus polishing to work reliably, retaining depth is important, so Q10 is the right balance here.
What the length distribution reveals: CLT01 and CLT02 have median read lengths of ~1,466–1,755 bp, well above the typical ITS amplicon size (~500–700 bp for fungi). These longer reads are raw amplicon reads that include the ITS region embedded in flanking rRNA sequences (18S/5.8S/28S). The max_read_length = 1000 chopper setting therefore deliberately captures only the shorter reads that are more likely to represent clean, full-length ITS amplicons, filtering out concatemers and off-target long fragments before clustering and polishing begin.
What ``max_read_length = 1000`` does to these samples: Because the median read lengths in CLT01 and CLT02 are 1,755 bp and 1,466 bp respectively — well above the 1,000 bp ceiling — the length filter removes the majority of raw reads. That is by design: those long reads contain the ITS region embedded inside longer flanking rRNA sequences, and they would produce mixed-content clusters. After chopper, only the shorter reads that are more likely to span a clean ITS amplicon survive. CLT16 is an exception: its median length was already 522 bp, so almost no reads are cut by the length filter (212 → 190 reads retained).
Output directory |
|
|---|---|
*.chopper.fasta.gz |
quality filtered sequences per sample in FASTA format |
Clustering (VSEARCH)
The clustering step uses VSEARCH to group similar sequences into clusters. This reduces the impact of sequencing errors and produces representative sequences for downstream analysis.
Configurable parameters:
similarity_threshold (default: 0.95) - Clustering identity threshold (0-1). Sequences with similarity above this threshold will be clustered together.
strands (default: “both”) - Check both strands or plus strand only during clustering.
Why clustering for ONT data:
Reduces impacts of sequencing errors by grouping similar sequences
Produces representative centroid sequences for each cluster
Improves computational efficiency for downstream polishing and taxonomy assignment
Output directory |
|
|---|---|
*.centroids.fasta.gz |
representative centroid sequences per sample |
Clustering results for this example dataset
After chopper filtering, VSEARCH groups reads into clusters at 95% identity:
Sample |
Reads in |
Clusters out |
What this means |
|---|---|---|---|
CLT01 |
1,046 |
594 |
~1.8 reads per cluster on average |
CLT02 |
4,294 |
2,510 |
~1.7 reads per cluster on average |
CLT15 |
163 |
115 |
~1.4 reads per cluster on average |
CLT16 |
190 |
132 |
~1.4 reads per cluster on average |
The low average reads-per-cluster reflects the diversity of this dataset and the ONT error rate: each unique ITS sequence produces its own centroid, but many clusters contain only one read (singletons). Singleton and small clusters are usually noise or rare off-target reads — the polishing step will expose this, as consensus calling requires multiple reads per cluster to be reliable.
Sequence polishing (racon + medaka)
Oxford Nanopore long reads often contain random errors that are corrected using a two-step polishing process:
Racon - First-pass polishing using multiple sequence alignment
Medaka - Neural network-based polishing for high-accuracy consensus sequences
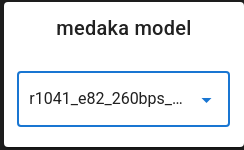
Configurable parameters:
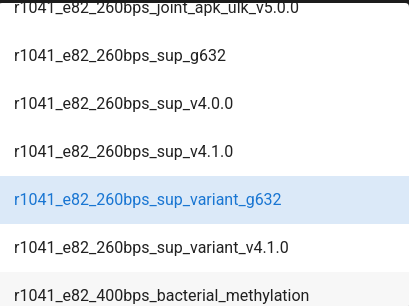
medaka_model (default: r1041_e82_400bps_hac_variant_v4.3.0) - Select the medaka model based on your flowcell, kit, and basecaller. In this example should set to r1041_e82_260bps_sup_variant_g632.
racon_quality_threshold (default: 20) - Minimum average base quality for windows used by Racon.
racon_window_length (default: 100) - Window length used by Racon for polishing.
Why these settings for this ONT ITS data:
What `racon_quality_threshold = 20` means: similar to chopper, this threshold uses Phred Q-scores, where Q20 ≈ 1% expected error per base. In Racon, this is not “keep/discard the whole read”; instead it is used to decide which local windows of the read are trusted enough to drive corrections. The goal is to prevent low-quality tails or error-rich segments from “pulling” the consensus away from the true ITS sequence.
Why 20 is reasonable here: after chopper filtering and clustering, most remaining reads are informative, but ONT errors are still present (especially indels in homopolymers). Setting the window threshold to Q20 makes Racon focus on the more reliable parts of alignments, and then Medaka further improves the consensus by correcting systematic ONT errors.
What `racon_window_length = 100` means: Racon evaluates quality and corrections in windows. A 100 bp window is a compromise for ITS-length amplicons: it is long enough to average out per-base noise (stability) but short enough to remain sensitive to localized error hotspots.
Tuning tips:
If you see over-correction or unstable consensuses (few reads per cluster, noisy data), try lowering racon_quality_threshold (e.g., 15–18) and/or reducing racon_window_length.
If your basecalling is very high quality and clusters have good depth, a higher threshold can yield a cleaner consensus, but may reduce how much of each read contributes to polishing.
Note
Select the appropriate medaka model based on your sequencing setup:
r1041_e82 models are for R10.4.1 flowcells with E8.2 chemistry
r941 models are for R9.4.1 flowcells
Choose hac (high accuracy) or sup (super accuracy) based on your basecalling model
The model affects consensus accuracy, so matching your setup is important

Output directory |
|
|---|---|
*.racon.fasta |
Racon-polished sequences per sample |
*.medaka.consensus.fasta |
Medaka-polished consensus sequences per sample |
Polishing results for this example dataset
Racon and Medaka both produce the same number of polished sequences — Medaka refines what Racon produced, it does not filter. The notable reduction vs. the number of clusters comes from a minimum cluster size requirement: clusters with very few reads do not yield a reliable consensus and are dropped.
Sample |
Clusters in |
Polished sequences out |
Reduction explained |
|---|---|---|---|
CLT01 |
594 |
156 |
438 clusters (74%) were too small to polish |
CLT02 |
2,510 |
544 |
1,966 clusters (78%) were too small to polish |
CLT15 |
115 |
33 |
82 clusters (71%) too small |
CLT16 |
132 |
17 |
115 clusters (87%) too small |
The high fraction of small clusters is expected in ONT data with moderate depth: sequencing errors spread reads across many near-identical but not identical sequences, producing many singleton clusters. The polishing step therefore acts as an implicit quality gate — only clusters with enough reads to build a trustworthy consensus survive.
ITS extraction (ITSx)
The ITS extraction step uses ITSx software to identify and extract the ITS rRNA gene region from your sequences. This is particularly valuable for fungal identification because:
Improves taxonomic accuracy: The ITS region is the standard barcode for fungi
Removes flanking regions: Eliminates 18S and 5.8S rRNA genes that may bias taxonomy assignment
Standardizes sequences: Produces comparable sequences for database matching
Pipeline option:
use_itsx (default: true) - Set to false if you want to skip ITS extraction (useful for non-ITS sequences)
Important considerations:
ITSx works best on full or near-full length amplicons
Sequences without detectable ITS regions will produce empty output files
The tool extracts both ITS1 and ITS2 regions when present
Output directory |
|
|---|---|
*.its.fasta |
extracted ITS sequences per sample |
ITS extraction results for this example dataset
This step is often where the most dramatic filtering occurs. ITSx only extracts sequences where it can detect the ITS region using fungal rRNA HMM profiles — consensus sequences from off-target amplification or non-ITS content simply produce no output.
Sample |
Medaka sequences in |
ITS sequences out |
Outcome |
|---|---|---|---|
CLT01 |
156 |
18 |
138 polished sequences had no detectable ITS region |
CLT02 |
544 |
37 |
507 polished sequences had no detectable ITS region |
CLT15 |
33 |
0 |
Analysis aborted — no ITS sequences detected at all |
CLT16 |
17 |
0 |
Analysis aborted — no ITS sequences detected at all |
CLT01 and CLT02: the large majority of polished sequences do not contain a recognizable ITS region. These are likely reads that passed length and quality filters but originate from flanking 18S/28S rRNA, off-target amplification, or are simply too divergent for ITSx to classify. Only the consensus sequences with a clear ITS1–5.8S–ITS2 architecture are extracted — 18 and 37 sequences respectively — and these carry forward into BLAST.
CLT15 and CLT16 — what went wrong: Both samples produced polished sequences (33 and 17 respectively), but ITSx found zero ITS regions in any of them. Looking back at the NanoPlot data: CLT16 had only 212 raw reads (the smallest dataset here), and its very low read count persisted through every step — 190 after chopper, 132 clusters, 17 polished. With such shallow depth, polished consensuses are noisy and are unlikely to match ITSx’s HMM profiles. CLT15 had better raw quality (Q17.0, 992 reads) but still produced no ITS — suggesting the sequenced material in this sample simply did not contain the fungal ITS region at the expected architecture. Both samples illustrate that quality filtering and polishing alone cannot rescue samples with insufficient depth or off-target sequencing content.
Taxonomy assignment (BLAST)
Taxonomy assignment uses BLAST to compare your sequences against a reference database and assign taxonomic classifications. This step is compulsory in the FunBarONT workflow, and the run will not start unless a BLAST database file is provided.
Configurable parameters:
database_file (required) - Reference database file in FASTA format. The pipeline will automatically create a BLAST database from this file.
run_id (default: “funbaront_run”) - Unique identifier for this analysis run. Used for naming output directories and files.
strands (default: “both”) - Query strand to search against database. “both” includes reverse complement.
e_value (default: 10) - E-value threshold. Lower values indicate more significant matches.
word_size (default: 11) - Initial word size for BLAST alignment.
Additional pipeline options:
output_all_polished_seqs (default: false) - Output all polished sequences even those without database hits (useful for non-ITS sequences).
rel_abu_threshold (default: 10) - Output only clusters with barcode-wise relative abundance above this percentage (0-100).
For fungal ITS barcoding:
Use a fungal ITS reference database such as:
UNITE database (https://unite.ut.ee/) - The standard reference database for fungal ITS sequences
Interpreting taxonomy output:
The BLAST results include taxonomic assignments at multiple ranks when available in the reference database. Not all sequences may have reliable classifications; sequences without database hits will have empty results.
Output directory |
|
|---|---|
*.blast.tsv |
BLAST results in tabular format per sample |
BLAST results for this example dataset
Every ITS sequence that passed extraction is passed to BLAST, with one result row per sequence:
Sample |
ITS seqs in |
BLAST hits |
Representative taxa found |
|---|---|---|---|
CLT01 |
18 |
18 |
Roussoella sp., Spegazzinia sp. (Ascomycota) |
CLT02 |
37 |
37 |
Pseudopestalotiopsis theae (Ascomycota) |
CLT15 |
0 |
0 |
No sequences passed ITSx; BLAST file is empty |
CLT16 |
0 |
0 |
No sequences passed ITSx; BLAST file is empty |
All 18 sequences from CLT01 and all 37 from CLT02 received BLAST hits, which is a good sign:
it confirms that the polishing pipeline successfully produced high-accuracy ITS consensus sequences
(note the ≥99% identity hits for the dominant clusters in the final Excel file).
The cluster size field in the BLAST output (e.g., size=64) indicates how many reads
supported that consensus — larger clusters generally yield more reliable taxonomy assignments.
Start the workflow
Once all parameters have been configured, press START on the left ribbon to begin the FunBarONT analysis.

The workflow will proceed through each step in sequence, with progress displayed in the PipeCraft2 interface.
first-time execution notes
… when running the FunBarONT pipeline for the first time, Docker will automatically pull the required container image. This may take several minutes depending on your internet connection and the image size.

Subsequent runs will use the cached image and will start more quickly.
Monitoring progress:
Each completed step will display a checkmark
Error messages will appear if any step fails
Processing time depends on the size of your dataset and computational resources available
Save workflow configuration
Once you have configured all parameters for your FunBarONT analysis, you can save the configuration file by pressing save workflow button on the right ribbon.

The configuration file will be saved as a JSON file (e.g., pipecraft2_last_run_configuration.json) in your working directory.
This file stores all your parameter choices and can be reloaded into PipeCraft2 to reproduce the exact same analysis in future runs.
automatic configuration backup
If you forget to manually save the configuration, PipeCraft2 will automatically generate
pipecraft2_last_run_configuration.json upon starting the workflow.
This serves as a backup of your analysis parameters for this working directory.
Final results and JSON output
The FunBarONT pipeline produces comprehensive final results in multiple formats:
Output directory |
|
|---|---|
*.results.json |
JSON formatted results per sample with all analysis data |
Main results file:
Output file |
Root output directory |
|---|---|
funbaront_run.results.xlsx |
Excel spreadsheet with all results (taxonomy, quality) |
README.md |
Summary of the pipeline run with parameters and citations |
Data interpretation and post-processing
Once the FunBarONT workflow is complete, you have several files for further analysis:
Primary output files:
funbaront_run.results.xlsx - Excel spreadsheet with comprehensive results including sequence info, taxonomy, and quality metrics
*.blast.tsv - BLAST results per sample in tabular format
*.its.fasta - Extracted ITS sequences per sample
*.medaka.consensus.fasta - Polished consensus sequences per sample
*.results.json - JSON formatted results for programmatic access
Output directory structure:
 <run_id>_results/
 ├── 01_quality_reports/          # NanoPlot quality reports per sample
 │   └── <sample>_NanoPlot_results/
 ├── 02_filtered_sequences/       # Chopper-filtered sequences
 ├── 03_clusters/                 # VSEARCH clustering centroids
 ├── 04_polished_sequences/       # Racon and Medaka polished sequences
 ├── 05_its_extracted/            # ITSx extracted ITS sequences
 ├── 06_blast_results/            # BLAST taxonomy results
 ├── 07_json_results/             # JSON formatted results
 ├── funbaront_run.results.xlsx   # Main results spreadsheet
 └── README.txt                    # Run summary and citations
Recommended post-processing steps:
Filter for target kingdom/phylum - Remove non-fungal OTUs if present
Examine unclassified OTUs - BLAST search or phylogenetic analysis
Summary statistics - Calculate diversity metrics, rarefaction curves
Downstream analyses - Community composition, differential abundance, etc.
Quality checks before downstream analyses:
Verify that the majority of OTUs are classified as fungi
Check for contamination (e.g., unusual taxa)
Examine OTU abundance distributions
Troubleshooting
Common issues and solutions:
Docker image pull fails
Issue: Error message about pulling the FunBarONT Docker image
Solution: Check your internet connection and ensure sufficient disk space for the image. Ensure Docker daemon is running properly.
Insufficient reads in output
Issue: Output OTU table contains very few sequences after processing
Solution:
Check quality filtering thresholds; they may be too stringent
Verify primer sequences are correct
Ensure input data quality is adequate
Review quality control metrics for the sequencing run
High proportion of unclassified OTUs
Issue: Many OTUs receive “Unclassified” taxonomy assignments
Solution:
Lower the minimum identity threshold in taxonomy assignment
Verify the reference database is appropriate for your samples
Consider BLAST search of unclassified OTUs against EUKARYOME database or a public database (NCBI)
Example output analysis
After the workflow completes, you can examine the output files to understand your fungal community composition.
Main Excel results file (default:funbaront_run.results.xlsx):
The Excel spreadsheet contains comprehensive results organized by sample with the following columns:
Sample: Sample identifier from input fastq file
Number of clusters: Total number of sequence clusters identified
Number of passed clusters: Clusters that passed the relative abundance threshold (default ≥10%)
Total reads after filtering: Number of quality-filtered reads for this sample
Cluster ID: Unique identifier for each consensus sequence
Cluster size: Number of reads grouped into this cluster
Cluster relative abundance: Percentage of reads in this cluster (%)
Cluster sequence: Trimmed ITS consensus sequence
Cluster sequence untrimmed: Full-length consensus sequence before ITS extraction
BLASTn taxonomy assignment: Species name from best BLAST match
BLASTn perc. ident.: Sequence similarity to database match (%)
BLASTn query coverage: Percentage of query sequence aligned (%)
BLASTn query length: Length of the query sequence (bp)
BLASTn subject length: Length of the database match sequence (bp)
BLASTn evalue: Statistical significance of the BLAST match
BLASTn subject SH: UNITE Species Hypothesis identifier (e.g., SH1292241.10FU)
BLASTn full taxonomy: Complete taxonomic lineage (k__Kingdom;p__Phylum;c__Class;o__Order;f__Family;g__Genus;s__Species)
Example rows from funbaront_run.results.xlsx (sequence columns omitted for brevity):
Sample |
Number of clusters |
Passed clusters |
Total reads |
Cluster ID |
Cluster size |
Rel. abundance (%) |
BLASTn taxonomy |
Perc. ident. |
Query cov. |
Query len. |
Subject len. |
E-value |
Subject SH |
Full taxonomy |
|---|---|---|---|---|---|---|---|---|---|---|---|---|---|---|
CLT16 |
Analysis aborted! No ITS sequences extracted by ITSx. |
- |
- |
- |
- |
- |
- |
- |
- |
- |
- |
- |
- |
- |
CLT15 |
Analysis aborted! No ITS sequences extracted by ITSx. |
- |
- |
- |
- |
- |
- |
- |
- |
- |
- |
- |
- |
- |
CLT01 |
18 |
3 |
138 |
d4c2f2d3-a5d6-4ce9-a8c3-d36a36963e9b |
64 |
46.38 |
Roussoella_sp |
99.123 |
100 |
454 |
528 |
0.0 |
SH1292241.10FU |
k__Fungi;p__Ascomycota;c__Dothideomycetes;o__Pleosporales;f__Roussoellaceae;g__Roussoella;s__Roussoella_sp |
CLT01 |
18 |
3 |
138 |
bfd8cc6d-385a-4b8f-ad8e-874b873ca304 |
25 |
18.12 |
Roussoella_sp |
99.781 |
100 |
456 |
528 |
0.0 |
SH1292241.10FU |
k__Fungi;p__Ascomycota;c__Dothideomycetes;o__Pleosporales;f__Roussoellaceae;g__Roussoella;s__Roussoella_sp |
CLT01 |
18 |
3 |
138 |
b4b3da0f-991d-4c3e-a03c-658d640e7436 |
14 |
10.14 |
Roussoella_sp |
99.781 |
100 |
456 |
528 |
0.0 |
SH1292241.10FU |
k__Fungi;p__Ascomycota;c__Dothideomycetes;o__Pleosporales;f__Roussoellaceae;g__Roussoella;s__Roussoella_sp |
CLT02 |
37 |
3 |
141 |
368c9255-821c-4d5a-a365-829ef52d5880 |
28 |
19.86 |
Pseudopestalotiopsis_theae |
99.359 |
100 |
468 |
491 |
0.0 |
SH1272767.10FU |
k__Fungi;p__Ascomycota;c__Sordariomycetes;o__Amphisphaeriales;f__Sporocadaceae;g__Pseudopestalotiopsis;s__Pseudopestalotiopsis_theae |
CLT02 |
37 |
3 |
141 |
85aeee25-1a09-4e44-aa40-9b38decc6fbd |
17 |
12.06 |
Pseudopestalotiopsis_theae |
99.359 |
100 |
468 |
491 |
0.0 |
SH1272767.10FU |
k__Fungi;p__Ascomycota;c__Sordariomycetes;o__Amphisphaeriales;f__Sporocadaceae;g__Pseudopestalotiopsis;s__Pseudopestalotiopsis_theae |
CLT02 |
37 |
3 |
141 |
374d0a9d-b74f-4a03-b832-faffa4605a81 |
16 |
11.35 |
Pseudopestalotiopsis_theae |
99.359 |
100 |
468 |
491 |
0.0 |
SH1272767.10FU |
k__Fungi;p__Ascomycota;c__Sordariomycetes;o__Amphisphaeriales;f__Sporocadaceae;g__Pseudopestalotiopsis;s__Pseudopestalotiopsis_theae |
Note
Each row represents a single cluster. Samples with multiple clusters will have multiple rows. Failed samples show error messages in the “Number of clusters” column (e.g., “Analysis aborted! No ITS sequences extracted”).
BLAST results files (*.blast.tsv):
Tab-separated files containing detailed BLAST alignments for each sample with columns:
Query sequence ID (cluster ID;size=N)
Subject sequence with full taxonomic path
Percent identity
Query coverage
E-value
Query length
Subject length
Empty BLAST files indicate no sequences passed quality filtering or ITSx extraction.
JSON results files (*.results.json):
Per-sample JSON files containing structured data:
number_of_clusters: Total number of consensus sequencestotal_reads_after_filtering: Number of reads after quality filteringcluster_data: Array of cluster objects with:cluster_id, cluster_size
cluster_sequence, cluster_sequence_untrimmed
blastn_tax_name, blastn_sh_id, blastn_full_taxonomy
blastn_pident, blastn_query_coverage, blastn_evalue
blastn_query_length, blastn_subject_length
relative_abundance (as decimal 0-1)