Inspect quality profiles
Quality scores are assigned to each nucleotide during base calling to indicate errors/accuarcies of the recorded base. Generally, the quality score of 30 indicates a trustfuly recorded base (99.9% accuracy).
Quality score |
Probability of incorrect base call |
Base call accuracy |
|---|---|---|
10 |
1 in 10 |
90% |
20 |
1 in 100 |
99% |
30 |
1 in 1000 |
99.9% |
40 |
1 in 10000 |
99.99% |
50 |
1 in 100000 |
99.999% |
60 |
1 in 1000000 |
99.9999% |
Average quality score of a sequence
However, an average quality score of 30 may be misleading in determining the reliability of a sequence. For example, the average quality score of a 100 base pairs (bp) sequence which has quality score of 37 for 80 bases and quality score of 6 for 20 bases, is 30.8; but the expected number of errors for that sequence is 5 (80 x 0.00020 + 20 x 0.25119 = 5.0398; see table for the error probabilities). I.e., the sequence may host errors accountable for 5% variation in that amplicon and thus is not reliable, and should be discarded during quality filtering.
Therefore, generally, the quality filtering based on the expected number of errors (sum of the error probabilities) is preferred over the average quality score threshold.
See here for the additional information about expected errors.
In PipeCraft2, examine the quality profiles and basic statistics of the your FASTQ files using the QualityCheck module, which
implements FastQC and MultiQC.

TO START:
SELECT FOLDER (a working directory) which contains fastq/fq files that you aim to inspect. Files can be gz compressed. Note that Windows OS does not display containing files; so double-check you are selecting the correct dir.)CREATE REPORT to start MultiQC.VIEW REPORT is displayed. Click on VIEW REPORT and a html file (multiqc_report.html) will open in your default web browser.If the summary does not open, check your working floder for the presence of multiqc_report.html in a quality_check directory and try to open with some other web browser.


Error
Something went wrong if the file multiqc_report.html does not exist (may fail e.g. when maximum number of fastq files in the folder is extremely large, >10 000).
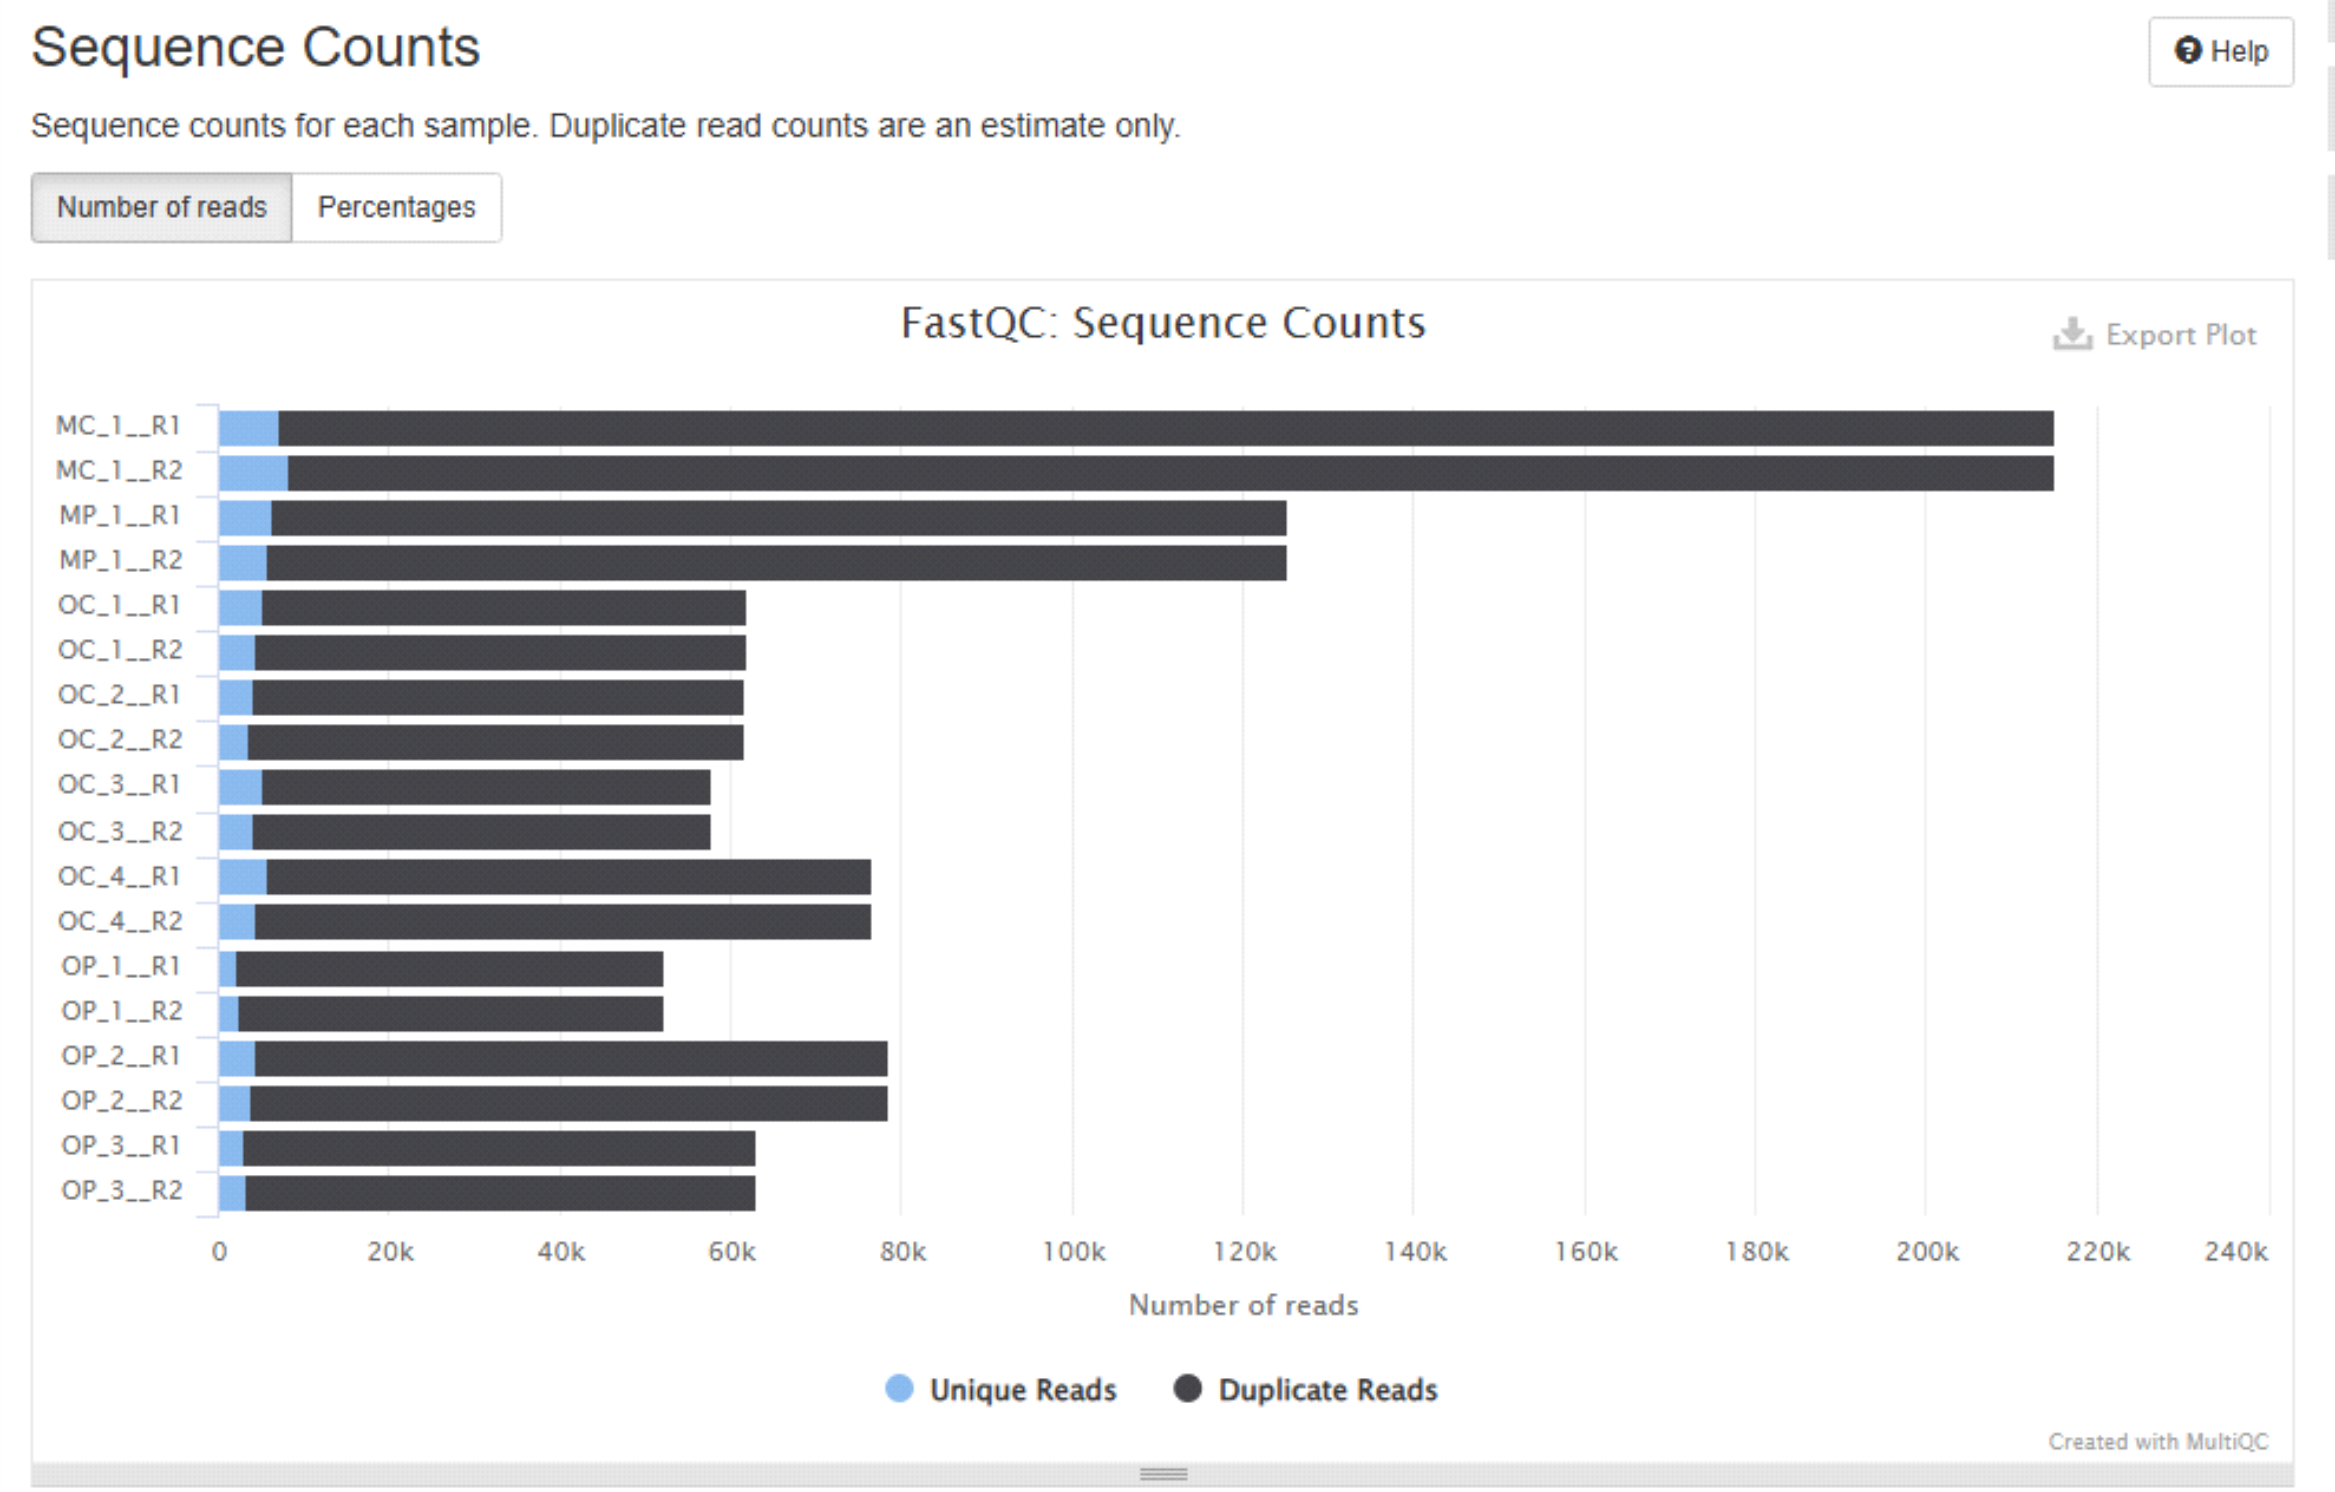
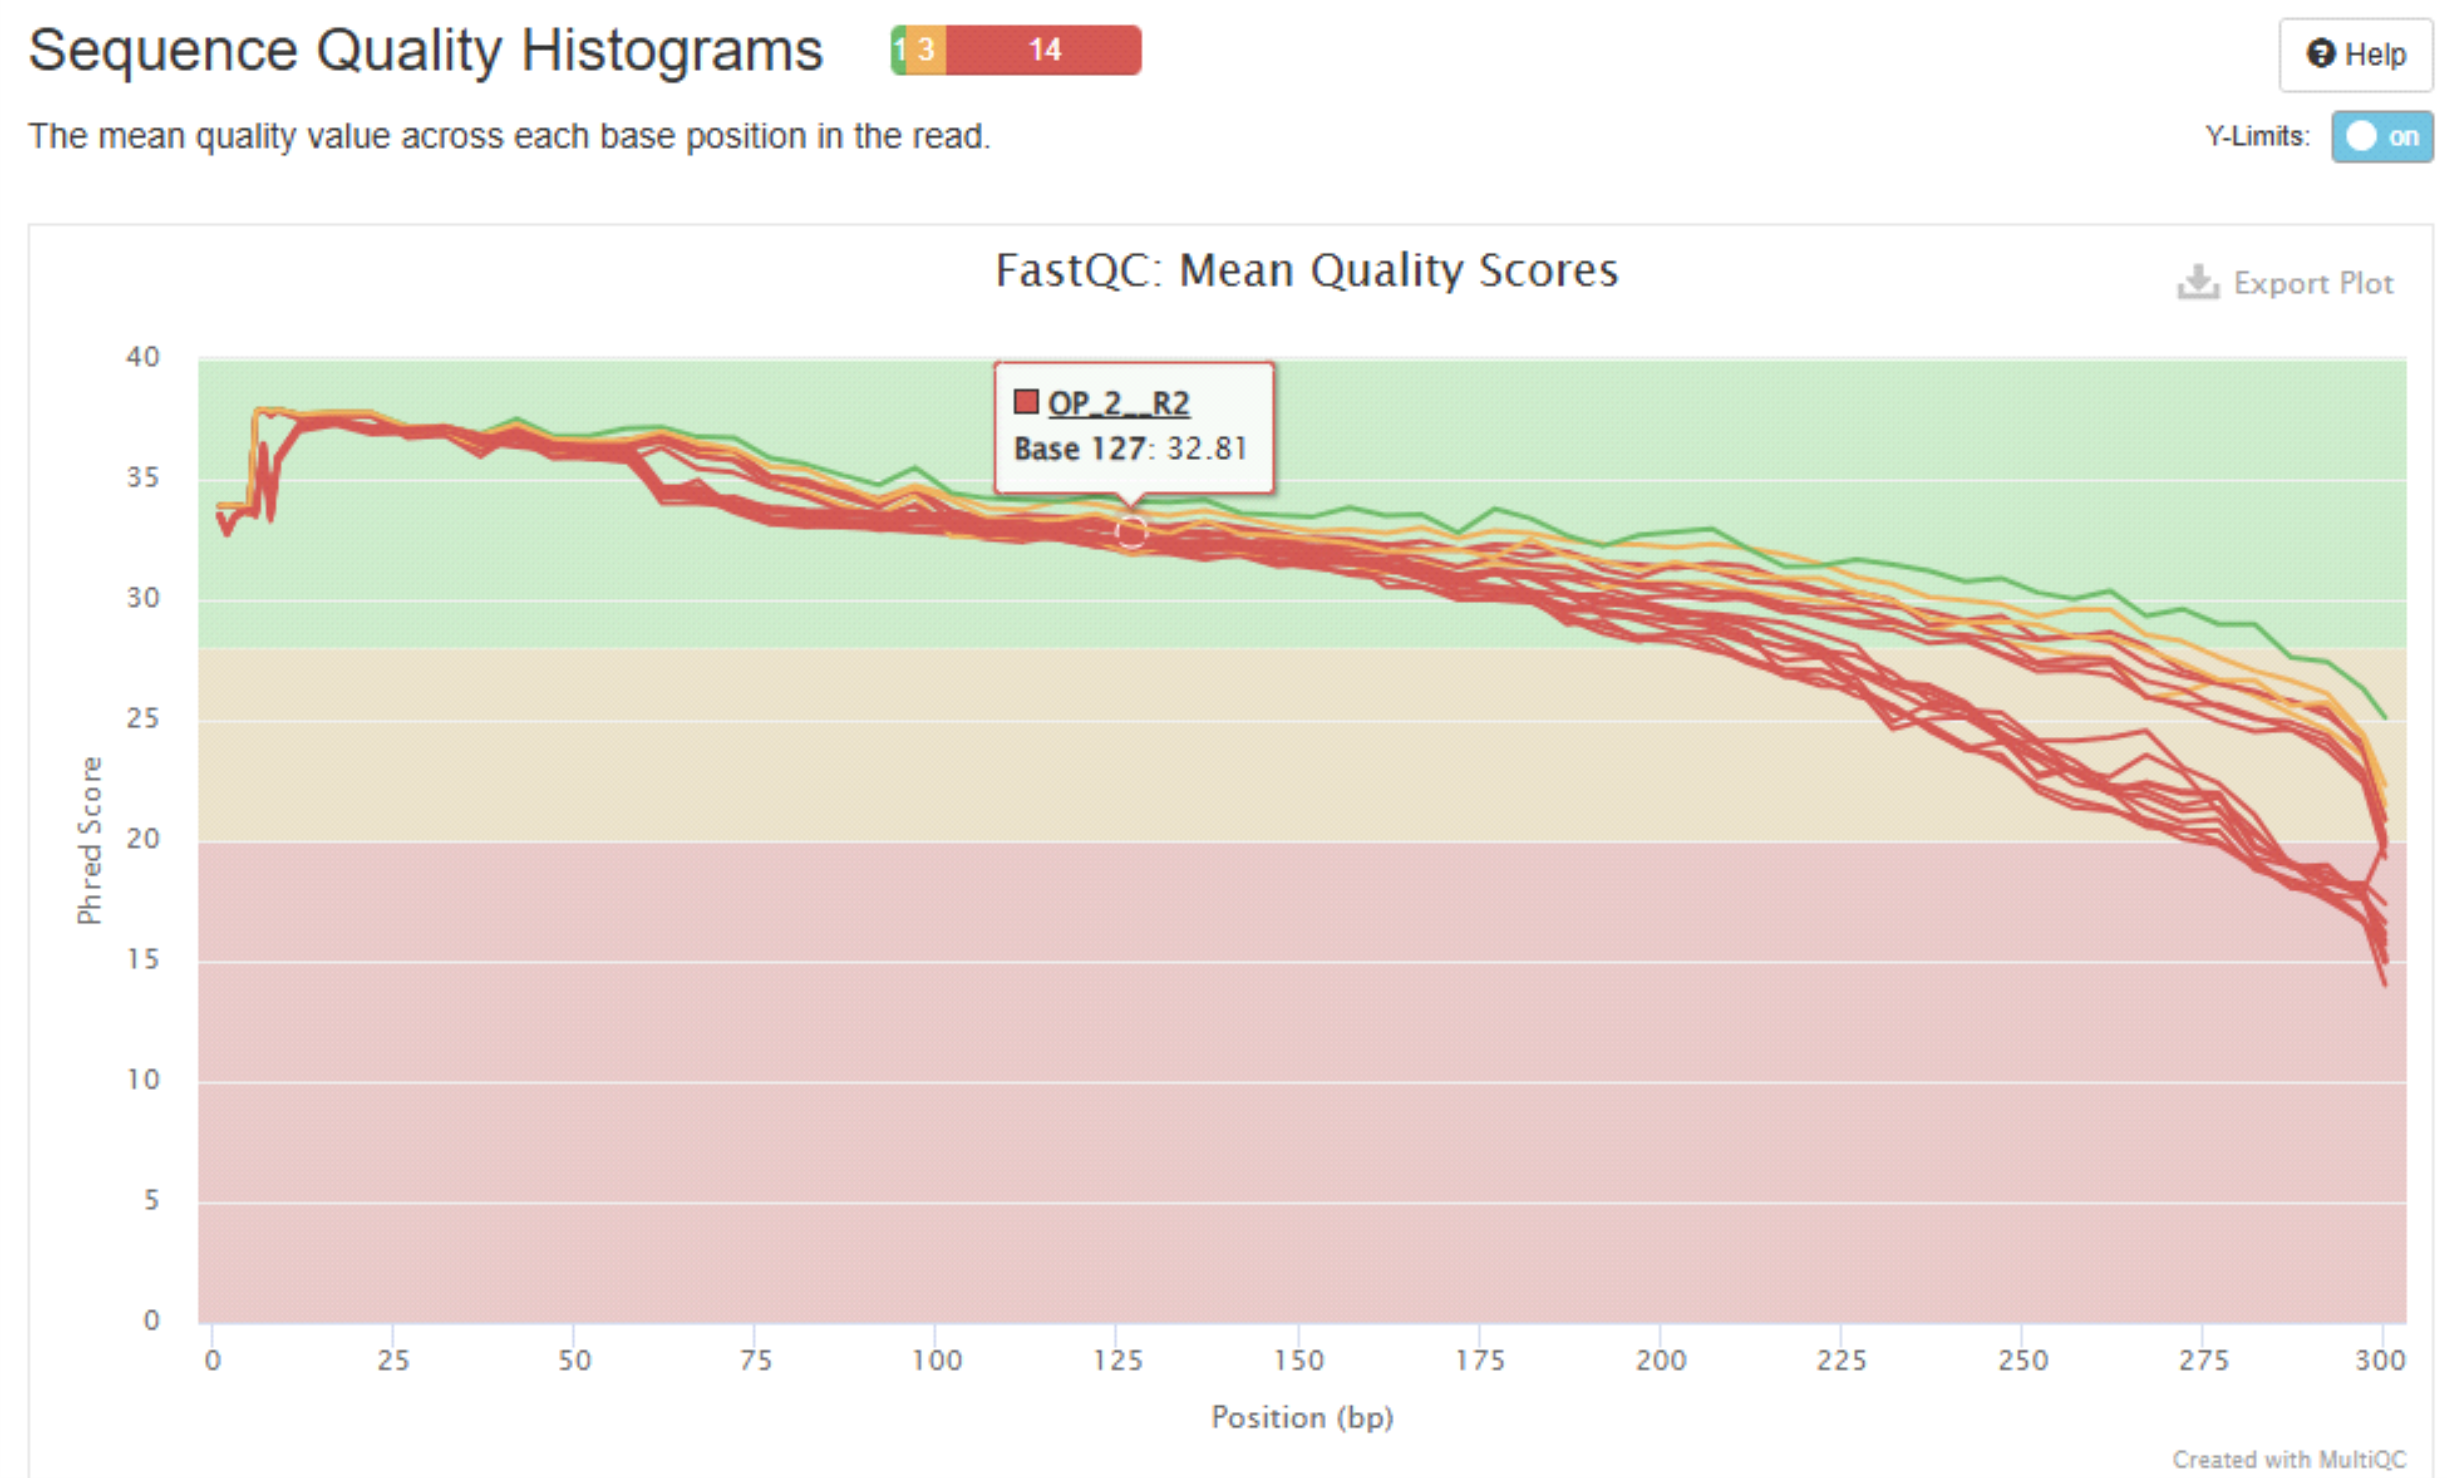
MultiQC report
MultiQC report allows to interactively examine the basic statistics and quality profiles of your input data.
Example plots generated by MultiQC:
More info about “using MultiQC reports” in MultiQC docs page.
Note
Note that ‘_fastqc.zip’ and ‘_fastqc.html’ are generated for each fastq file in the ‘quality_check’ directory. These are summarized in multiqc_report.html, so you may examine or delete all individual ‘_fastqc.zip’ and ‘_fastqc.html’ files if those are of no interest.
Remove low-quality ends/starts of reads
If the quality profile of the sequences is poor at the starts or ends of reads, then
applying sequence truncation/stripping settings in the quality filtering step may be helpful.
Reads that would otherwise fail maxee (sum of per-base error probabilities derived from Phred scores)
because of a noisy tail can then pass filtering and be retained in the dataset.
For paired-end data, cleaner 3′ and 5′ ends also tend to improve read merging: overlap regions
may be easier to align when error-prone tails are trimmed, and base calls in the overlap are
more trustworthy for conflict resolution.
After all truncation,
reads shorter than minLen / min length are discarded,
and maxEE is evaluated on the truncated sequence.
trunc length(vsearch –fastq_trunclen) cuts every read to at most specified length (bases counted from the 5′ end). Reads shorter than the specified length are discarded. Use this when quality or noise rises predictably toward the 3′ end and you want a fixed read length. If the specified length is too small you may reduce overlap for merging paired-end reads.truncqual(vsearch –fastq_truncqual) scans each read from the 5′ end toward the 3′ end and truncates at the first base whose Phred quality is less than or equal to the threshold you set. The kept sequence part is the longest 5′ segment where every remaining quality score is strictly greater than the threshold.truncee(vsearch –fastq_truncee) shortens the read from the 3′ end until the total expected errors (sum of per-base error probabilities from Phred scores over the kept read part) is ≤ the value you set. Unliketrunc length, the cut length differs per read. It removes noisy tails while keeping as much length as the quality scores allow under specified expected errors threshold.strip_left(vsearch –fastq_stripleft) removes a fixed number of bases from the 5′ end of every read (independent of per-base quality scores).strip_right(vsearch –fastq_stripright) removes a fixed number of bases from the 3′ end of every read (independent of per-base quality scores).
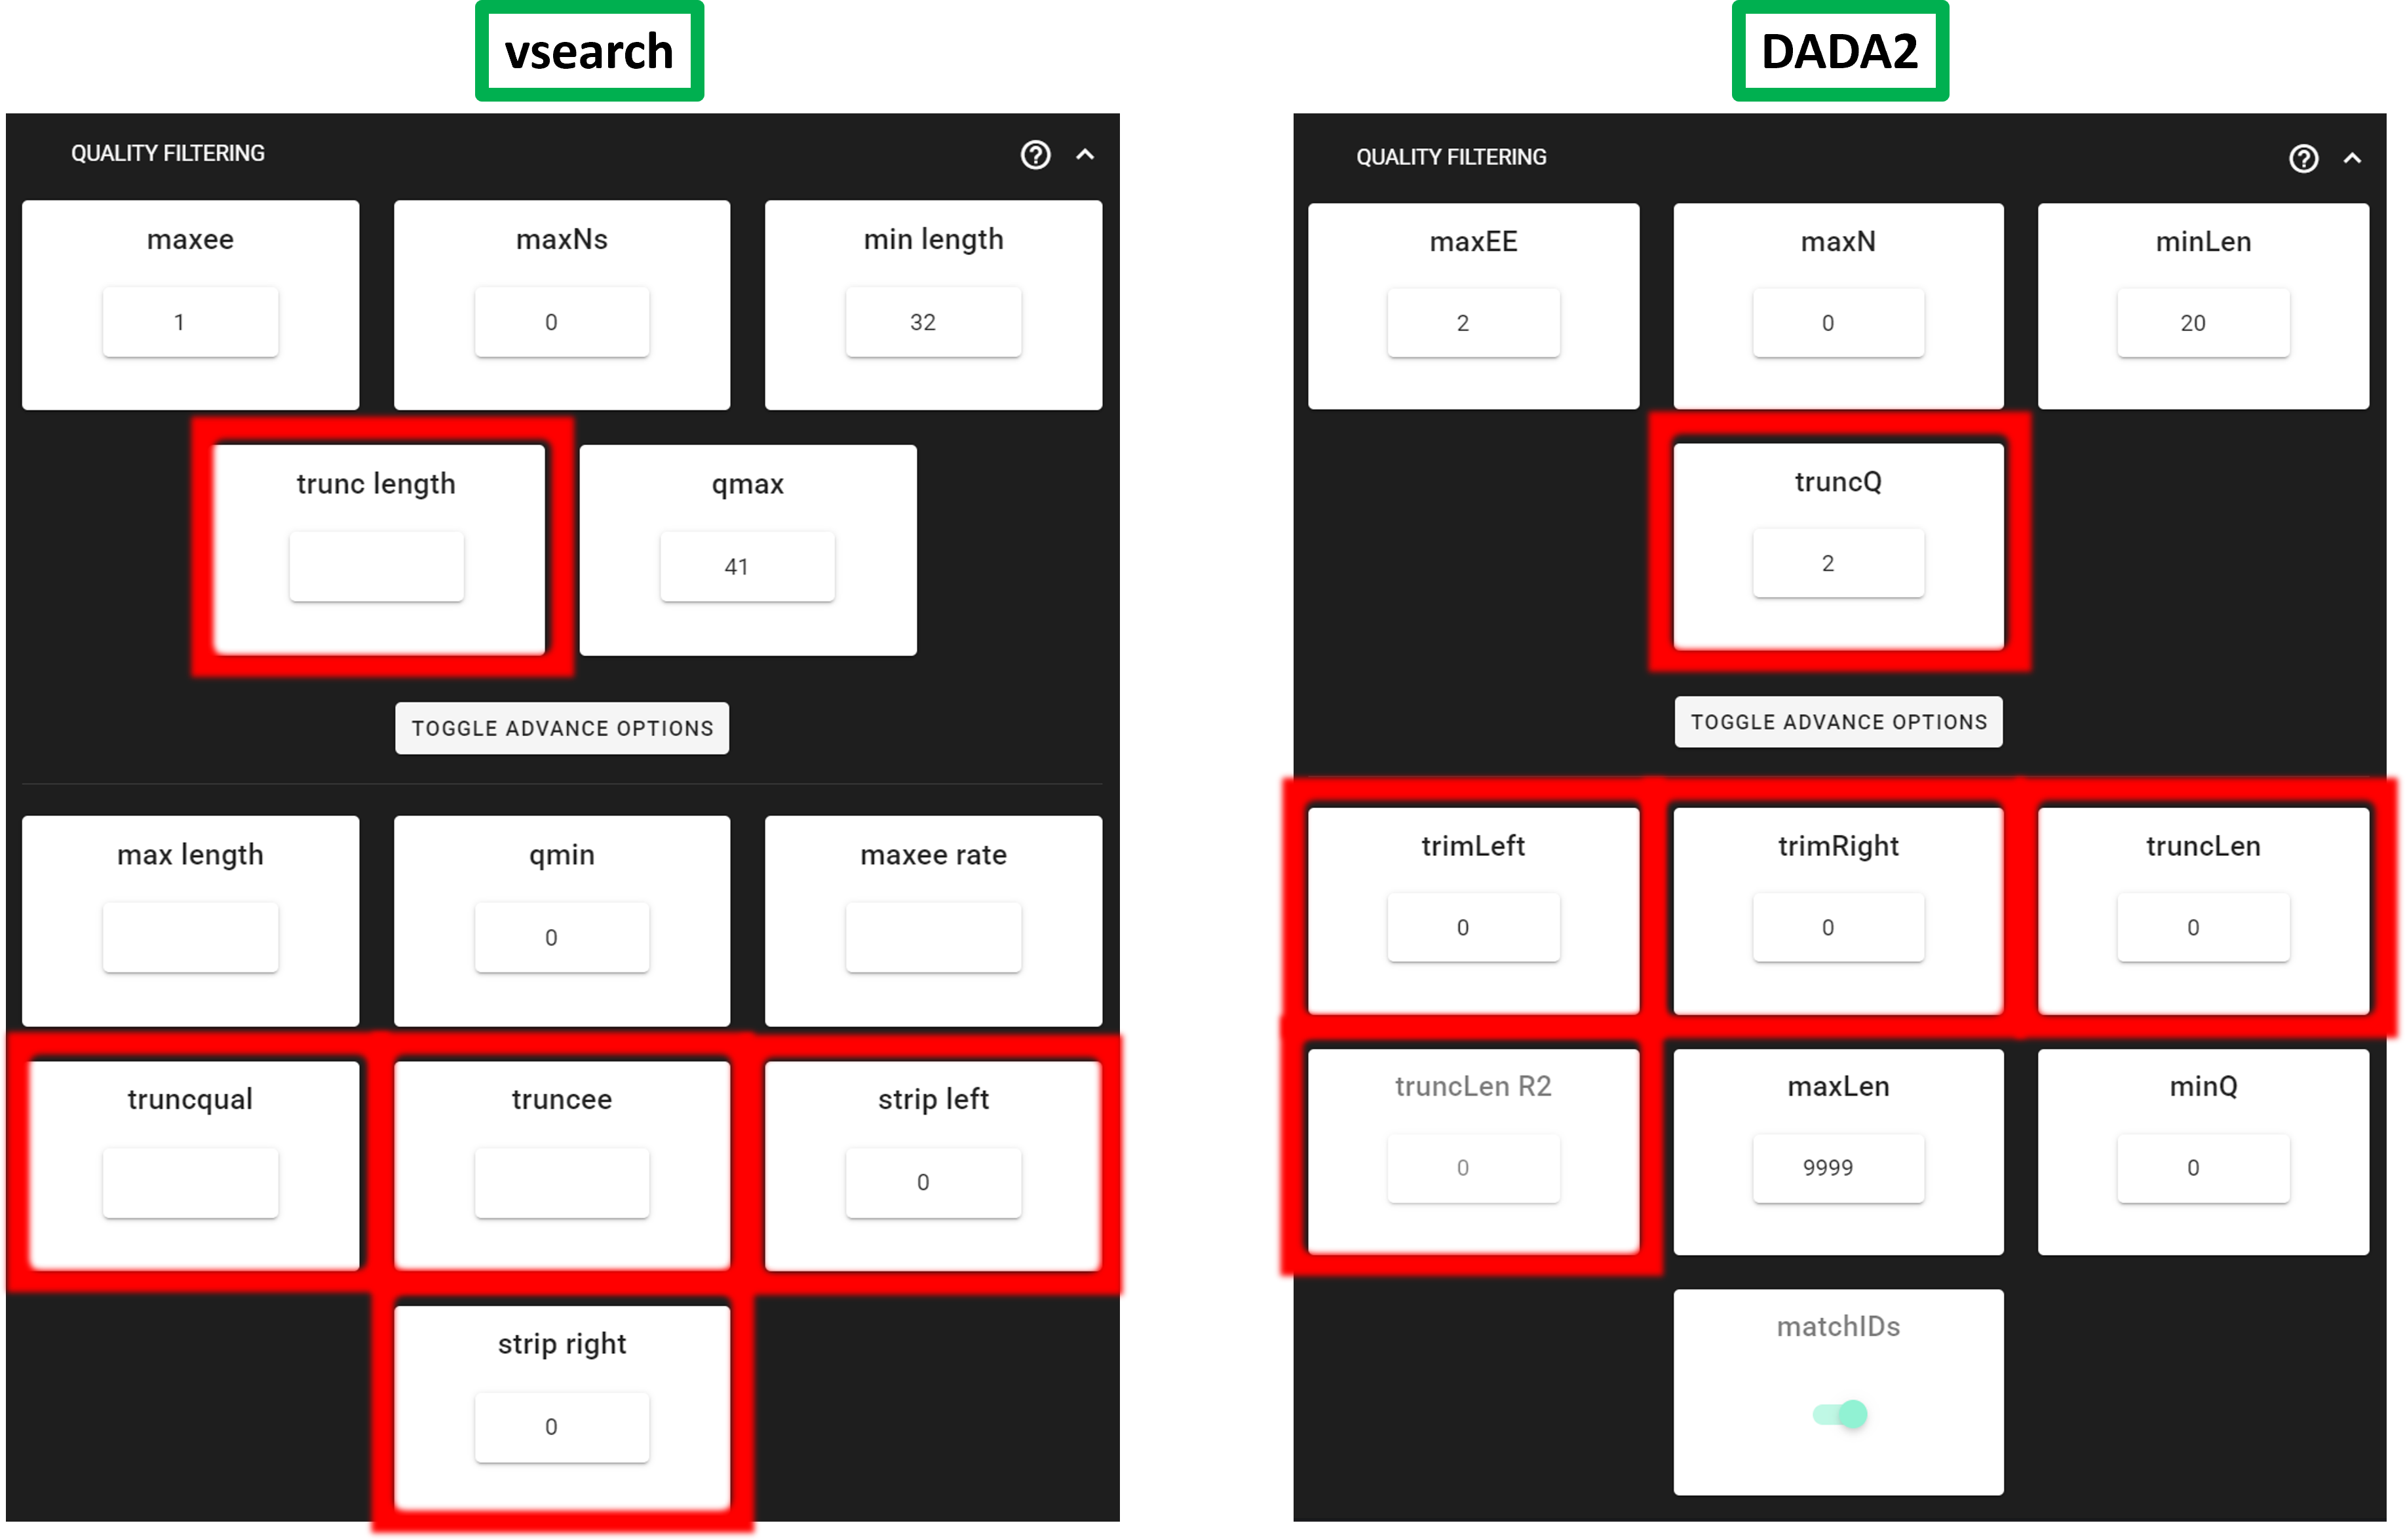
In DADA2 quality filtering (filterAndTrim):
truncQscans each read from the 5′ toward the 3′ end and cuts at the first position whose Phred quality is less than or equal to the specified quality score value.truncLen— after anytrimLeft/trimRight, truncate R1 (single-end: the only read) to exactly specified length (number of bases) by keeping the 5′ segment. Reads shorter than the specified length after trimming are removed. This is a fixed length cut (not quality score based); use it when the quality profile shows a clear point to drop the noisy 3′ tail for R1.maxEEis applied after this truncation.truncLen_R2— paired-end only. Same idea astruncLenbut applied to R2 only. R1 and R2 may need different values because R2 quality commonly drops faster than R1.trimLeft— remove a fixed number of bases from the 5′ end of each read (R1 and R2 in paired-end) beforetruncLen/truncLen_R2and beforemaxEE.trimRight— remove a fixed number of bases from the 3′ end of each read before length truncation andmaxEE. Use when there is a known uniform artefact at the read end (e.g. after adapter removal) or a short low-quality tail that is easier to cut with a constant length than withtruncQ/truncLenalone.
Note
Truncation/stripping reduces read length, thus the effective amplicon length you keep. That can be desirable for quality, but if trimming is too aggressive you may lose overlap between R1 and R2 (harder or impossible merging) or retain only a truncated fragment of the true amplicon. Balance trimming against insert length and the overlap you need for merging paired-end reads.
Quality scores table
The table of quality (Phred) scores and corresponding probabilities of base calling errors. The ASCII column denotes the quality score representations in the fastq file (note that old Illumina fastq files have different Phred score encoding).
Quality score |
Error probability |
ASCII |
Quality score |
Error probability |
ASCII |
|---|---|---|---|---|---|
0 |
1.00000 |
! |
22 |
0.00631 |
7 |
1 |
0.79433 |
" |
23 |
0.00501 |
8 |
2 |
0.63096 |
# |
24 |
0.00398 |
9 |
3 |
0.50119 |
$ |
25 |
0.00316 |
: |
4 |
0.39811 |
% |
26 |
0.00251 |
; |
5 |
0.31623 |
& |
27 |
0.00200 |
< |
6 |
0.25119 |
' |
28 |
0.00158 |
= |
7 |
0.11953 |
( |
29 |
0.00126 |
> |
8 |
0.15849 |
) |
30 |
0.00100 |
? |
9 |
0.12589 |
* |
31 |
0.00079 |
@ |
10 |
0.10000 |
+ |
32 |
0.00063 |
A |
11 |
0.07943 |
, |
33 |
0.00050 |
B |
12 |
0.06310 |
- |
34 |
0.00040 |
C |
13 |
0.05012 |
. |
35 |
0.00032 |
D |
14 |
0.03981 |
/ |
36 |
0.00025 |
E |
15 |
0.03162 |
0 |
37 |
0.00020 |
F |
16 |
0.02512 |
1 |
38 |
0.00016 |
G |
17 |
0.01995 |
2 |
39 |
0.00013 |
H |
18 |
0.01585 |
3 |
40 |
0.00010 |
I |
19 |
0.01259 |
4 |
41 |
0.00008 |
J |
20 |
0.01000 |
5 |
|||
21 |
0.00794 |
6 |
So, such a sequence with associated encoded quality scores …
@M02459:45:000000000-ATN9N:1:1101:9884:1029 1:N:0:247
ATGAATCATCGAATCTTTGAACGCA
+
&8BCCGGGGGAAGGGGGG,CFFGGG
@M02459:45:000000000-ATN9N:1:1101:9884:1029 1:N:0:247
A   T   G   A   A   T   C   A   T   C   G   A   A   T   C  T   T   T   G   A   A   C   G   C   A
5  23  33  34  34  38  38  38  38  38  32  32  38  38  38  38  38  38  11  34  37  37  38  38  38